Track app sales and analytics
See revenue, orders, product views and installs from your mobile app, and how shoppers move from browsing to buying.
Analytics shows how your mobile app performs. Everything on this page counts activity in the app only, not on your website.
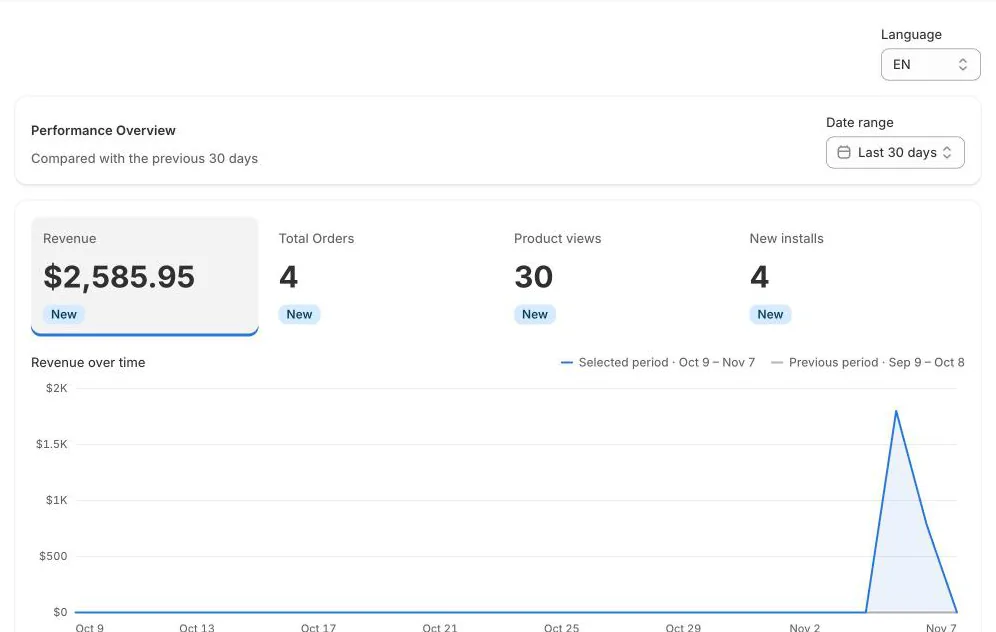
What you can see
- Revenue and Total Orders: orders placed in the app. Cancelled orders are left out.
- Product views and New installs.
- A chart of each metric over time. Click a metric to chart it, compared with the previous period.
- Shopping activity: how shoppers move from viewing products to adding them to cart and placing orders, with your view-to-order rate.
- Installs by platform: Android vs. iOS.
Change the date range
Use Date range at the top to switch periods, or choose Custom range. Every number compares with the period of the same length just before it.
Quick summary on the Dashboard
The Dashboard also shows Your mobile app at a glance for the last 30 days: app installs, orders, revenue and product views. Click View analytics for the full page.
TipA New badge means there's no earlier period to compare with yet, for example in your app's first month.